
In this article
- Introduction
- 1. What Is a Restaurant P&L?
- 2. The Basic Structure of a Restaurant P&L
- 3. Sales and Revenue
- 4. Cost of Goods Sold
- 5. Gross Profit
- 6. Labor Cost
- 7. Prime Cost
- 8. Other Operating Expenses
- 9. Operating Income
- 10. Operating Income vs. Net Income
- 11. Dollars and Percentages Tell Different Stories
- 12. How to Compare One P&L Period to Another
- 13. Common Mistakes When Reading a Restaurant P&L
- 14. How the P&L Connects to Break-Even
- 15. How the P&L Connects to Contribution Margin
- 16. A Practical P&L Review Process
- 17. The Better Question
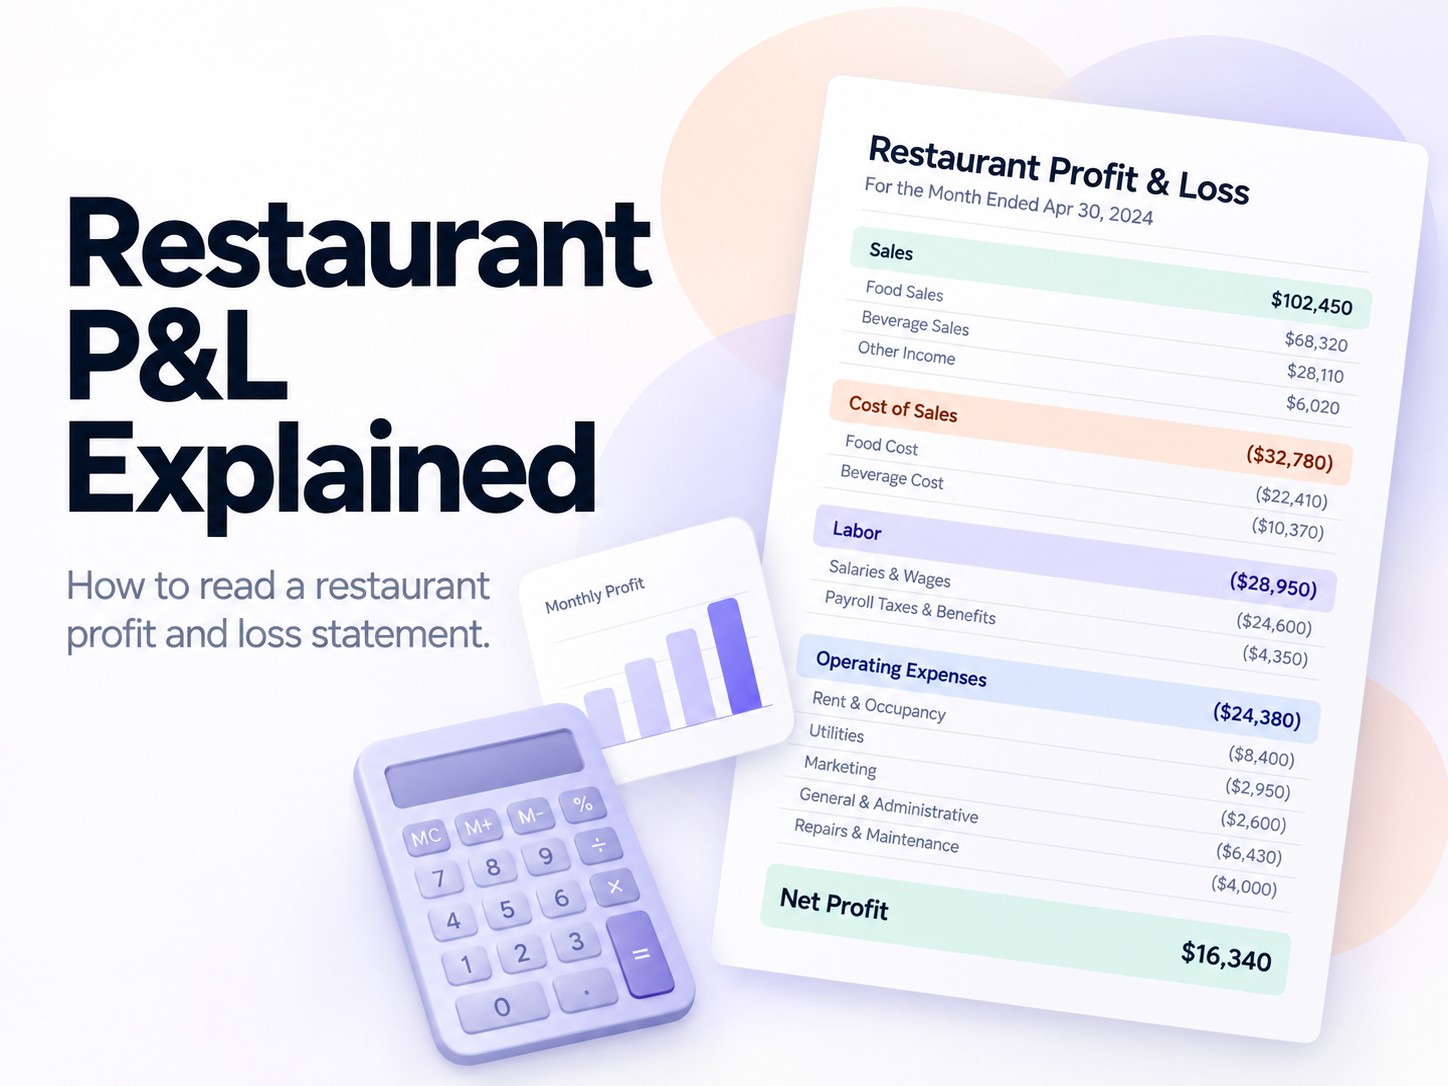
Restaurant operators often receive a profit and loss statement full of numbers and still struggle to answer a basic question: “What is this actually telling me about the business?”
A P&L is more than an accounting document. Used well, it helps an operator understand sales, food and beverage costs, labor, prime cost, operating expenses, operating income, trends, and variances. The goal is not simply to read from the top line to the bottom line. The goal is to understand what changed between them—and what deserves investigation.
1. What Is a Restaurant P&L?
A Profit and Loss Statement summarizes revenue and expenses over a defined period and shows the resulting profit or loss according to the accounting structure being used. Restaurants may review one weekly, by accounting period, monthly, quarterly, or annually.
P&L
Shows financial performance over a period.
Balance sheet
Shows financial position at a point in time.
The two reports answer different questions. This article focuses on interpreting the operating story within the P&L.
2. The Basic Structure of a Restaurant P&L
- Sales / Revenue
- − Cost of Goods Sold
- = Gross Profit
- − Labor
- − Other Operating Expenses
- = Operating Income
This is a simplified management view, not a universal GAAP-format prescription. Actual restaurant reports may place labor differently, use additional subtotals, or classify expenses according to the accounting system, chart of accounts, ownership structure, and management reporting style.
3. Sales and Revenue
Sales are the top line. A restaurant may separate food, alcoholic beverage, nonalcoholic beverage, catering, delivery, events, and other revenue. Gross sales, discounts, comps, refunds, and net sales can also be presented differently depending on the system.
A percentage is only useful when you know what the denominator represents.
Before comparing cost percentages, confirm which sales basis the P&L uses and whether that basis is consistent across the periods being reviewed.
4. Cost of Goods Sold
Cost of goods sold, or COGS, represents the product cost associated with the period under the inventory structure being used.
Beginning Inventory + Purchases + Transfers In − Transfers Out − Ending Inventory = Cost of Goods Sold
A restaurant P&L may separate food, beer, wine, liquor, nonalcoholic beverage, and other direct product costs. Inventory accuracy, invoice timing, transfers, and classification all affect the result. For the relationship between period COGS and sales, see What Is Food Cost Percentage? How to Calculate It and Use It.
5. Gross Profit
Sales − COGS = Gross Profit
In a hypothetical simplified management example, net sales are $100,000 and COGS is $28,000. Gross profit is therefore $72,000, and gross margin is 72.0%.
Gross profit tells you what remains after COGS—not what the business ultimately earned.
Labor and other operating expenses still remain. Gross profit is not net profit.
6. Labor Cost
Labor is often one of the most important operating sections. Depending on the reporting structure, it may include hourly wages, salaries, overtime, payroll taxes, benefits, bonuses or incentives, and other labor-related expenses.
Loaded-labor definitions vary, so operators should confirm what is included before comparing percentages. In the hypothetical example, labor is $32,000 on $100,000 of net sales, producing a 32.0% labor cost. See Labor Cost Percentage Explained: How to Calculate It and What Drives It for the calculation and operational drivers.
7. Prime Cost
COGS + Labor = Prime Cost
Using the same hypothetical figures, $28,000 of COGS plus $32,000 of labor equals $60,000 of prime cost, or 60.0% of net sales. This is an educational example, not a universal target or benchmark.
Prime cost connects two major operating cost categories before the rest of the P&L is considered. Prime Cost Explained: How Food and Labor Costs Work Together shows why reviewing the two together can reveal pressure that either percentage alone may hide.
8. Other Operating Expenses
After product and labor costs, the restaurant still has occupancy or rent, utilities, insurance, repairs and maintenance, software, payment costs where classified, linen, cleaning, marketing, professional fees, administrative expenses, licenses, supplies, and other operating costs.
Classification differs between P&Ls. The useful question is not whether every report uses the same chart of accounts, but whether the restaurant understands its definitions and applies them consistently enough to compare performance.
9. Operating Income
Continue the hypothetical simplified management example:
$100,000 − $28,000 − $32,000 − $30,000 = $10,000
In this simplified example, $10,000 remains after the included operating costs, equal to 10.0% of net sales. Whether it matches accounting net income depends on what additional expenses, taxes, financing items, depreciation, or other lines remain below it. It should not automatically be called net profit.
10. Operating Income vs. Net Income
Operating Income
Focuses on operating performance before some below-the-line items.
Net Income
Reflects the ultimate bottom line after the additional items included by that reporting structure.
Those additional lines may include interest expense, depreciation, amortization, taxes, nonoperating income or expense, and owner-related items depending on structure. Exact presentation varies, so the operator should read the labels and definitions in the actual statement.
11. Dollars and Percentages Tell Different Stories
Period A
Sales: $100,000
Labor: $32,000
Labor: 32.0%
Period B
Sales: $115,000
Labor: $34,000
Labor: approximately 29.6%
Labor dollars rose by $2,000 while labor percentage fell by 2.4 percentage points. Both facts are true. Reviewing only dollars can hide how costs moved relative to sales; reviewing only percentages can hide the actual dollars spent.
12. How to Compare One P&L Period to Another
Review actual dollars, percentage of sales, the prior period, budget or forecast where available, prior year where useful, and the operating context.
- Did sales change?
- Did cost dollars change?
- Did percentages change?
- Was the change isolated or broad?
- Was there an operational reason?
- Was accounting classification consistent?
A variance identifies where to investigate. It does not automatically explain why. Volume, mix, timing, waste, staffing, pricing, purchasing, and classification may all require examination.
13. Common Mistakes When Reading a Restaurant P&L
- Jumping directly to bottom-line profit
- Reviewing percentages without dollars
- Reviewing dollars without sales context
- Comparing periods with different definitions
- Ignoring inventory accuracy or sales mix
- Treating every unfavorable variance as a cost-cutting problem
- Failing to separate one-time expenses from recurring patterns
- Assuming accounting classifications are operational diagnoses
- Focusing on one metric without seeing its relationship to others
14. How the P&L Connects to Break-Even
The P&L helps identify the cost structure that informs break-even planning. Break-even asks how much sales contribution is required to cover the modeled costs. Actual P&L performance can improve the assumptions used in that model, provided the costs are classified consistently.
Break-Even Point Explained: How Much Does Your Restaurant Need to Sell? develops that relationship.
15. How the P&L Connects to Contribution Margin
Contribution analysis helps operators understand what remains after selected variable or direct costs to help cover the other expenses visible on the P&L. The costs included must be stated clearly, and contribution must not be confused with net profit.
Continue with Contribution Margin Explained: What Each Sale Leaves to Cover the Rest of the Business.
16. A Practical P&L Review Process
- Confirm the reporting period.
- Confirm the sales basis.
- Review sales dollars and mix.
- Review COGS dollars and percentages.
- Review labor dollars and percentages.
- Review prime cost.
- Review major operating-expense categories.
- Review operating income.
- Compare relevant prior periods or targets.
- Identify material variances.
- Investigate operational drivers.
- Decide what requires action.
- Monitor whether the action changes the result.
This sequence turns the P&L from a static report into a disciplined operating conversation.
17. The Better Question
Instead of asking only, “Did we make money?” ask:
“What changed in the P&L, what operational decisions or conditions drove those changes, and what does the business need to do differently next?”
That question moves the operator from reporting to operating. It connects financial results to the conditions and decisions that produced them—and to the next action worth testing.
RELATED ARTICLE
Start with two of the biggest numbers on the P&L.
Continue with Prime Cost Explained to see how cost of goods sold and labor work together—and why reviewing them together can reveal operating pressure that either percentage alone may hide.