
In this article
- Introduction
- 1. What Is Contribution Margin?
- 2. Contribution Dollars vs. Contribution Margin %
- 3. A Simple Menu Item Example
- 4. Why Contribution Dollars Matter
- 5. Food Cost Percentage and Contribution Margin
- 6. Contribution Margin Is Not Profit
- 7. Why a Lower Food Cost Percentage Is Not Automatically Better
- 8. Contribution Margin and Menu Pricing
- 9. Contribution Margin and Break-Even
- 10. Contribution Margin and Sales Mix
- 11. What Can Reduce Contribution Margin?
- 12. How to Evaluate Contribution More Usefully
- 13. The Better Question
A restaurant sells a menu item for $15. Its direct recipe cost is $5. Does that mean the restaurant “made” $10?
No. The amount remaining still has to help support labor, occupancy, utilities, insurance, software, maintenance, marketing, management, debt or financing obligations where applicable, and the other expenses involved in operating the business.
Contribution margin helps explain what remains after the variable or direct costs included in a particular calculation. The definition matters because different models may include different costs. Contribution is not the same thing as profit.
1. What Is Contribution Margin?
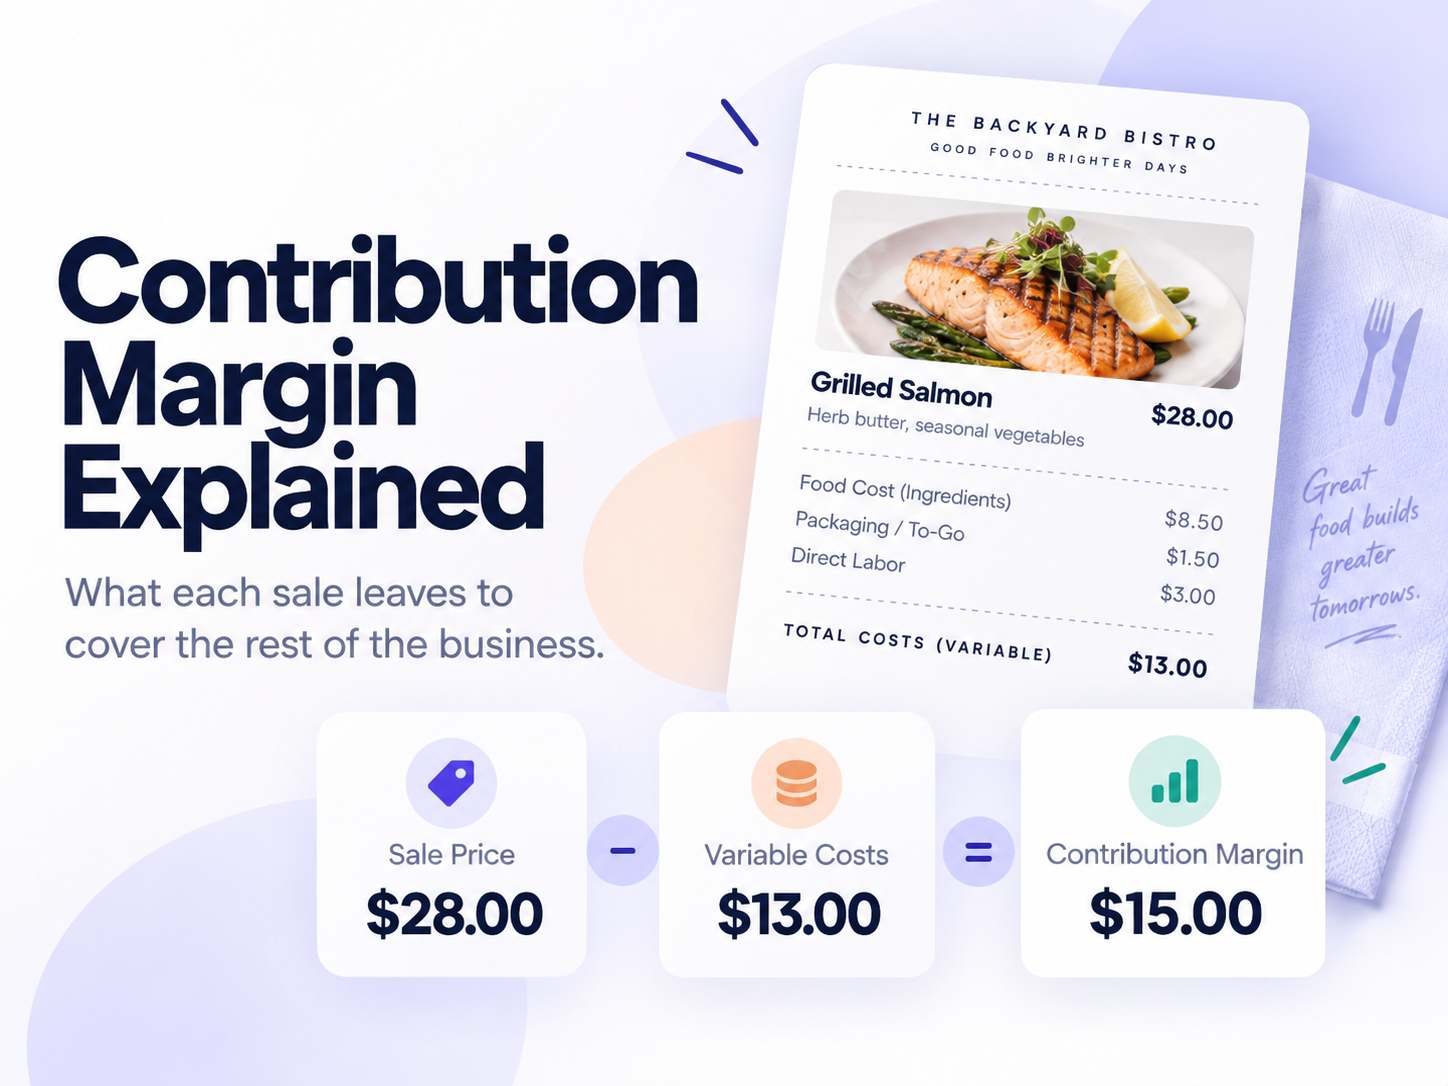
Contribution margin describes the amount of sales remaining after the variable or direct costs included in the calculation are deducted.
Sales − Included Variable Costs = Contribution
For a menu-item recipe analysis in which only direct recipe cost is included, the practical item-level calculation is:
Menu Price − Direct Recipe Cost = Menu Price Less Direct Cost
Hospitality Explained describes the related percentage as Contribution Margin Before Labor & Overhead. This language makes the boundary of the calculation clearer. Neither result should automatically be labeled gross profit or net profit.
2. Contribution Dollars vs. Contribution Margin %
Contribution dollars
The number of dollars remaining after the included variable or direct costs.
Contribution margin %
The percentage of sales remaining after those same costs.
Contribution ÷ Sales × 100 = Contribution Margin %
Both views matter. Dollars show how much a sale contributes toward the rest of the operation. Percentage shows how efficiently each sales dollar produces that contribution under the model. Looking at only one can hide important context.
3. A Simple Menu Item Example
Consider the established Signature Wings example:
$15.00 − $5.19 = $9.81
$9.81 ÷ $15.00 × 100 ≈ 65.4%
The $9.81 remains from the sale after the direct costs included in this calculation. It is not $9.81 of profit or owner earnings. It still has to support labor and the rest of the operation.
4. Why Contribution Dollars Matter
Percentage alone can be misleading. Compare two hypothetical items:
Item A
Selling price: $10
Direct cost: $2
Food cost: 20%
Contribution dollars: $8
Item B
Selling price: $30
Direct cost: $10
Food cost: 33.3%
Contribution dollars: $20
Item B has the higher food-cost percentage, but it also generates substantially more contribution dollars. That does not prove Item B is universally better. Demand, labor, preparation, capacity, guest value, and the rest of the operating model still matter. The example simply shows why percentage alone cannot answer every menu-economic question.
5. Food Cost Percentage and Contribution Margin
When the same direct-cost base is used, recipe food-cost percentage and the margin before labor and overhead are mathematical complements. If recipe food cost is 34.6%, the corresponding margin before labor and overhead is approximately 65.4%.
That inverse relationship works cleanly only when both calculations include the same direct-cost base. If packaging, transaction fees, commissions, or other variable costs are added to one model, contribution margin changes. Restaurants do not all define variable cost identically, so consistency is more useful than pretending there is one universal definition.
6. Contribution Margin Is Not Profit
Sales minus cost of goods sold or other direct costs may leave a form of contribution or gross margin, depending on the accounting model. But the restaurant may still need to cover labor, rent, utilities, insurance, repairs, software, marketing, administrative expenses, debt, taxes, and other costs.
Contribution tells you what remains to help cover the rest of the business. It does not tell you what the owner ultimately keeps.
A useful analysis names the costs included and avoids claiming that one presentation is universal. For a broader view of two major cost categories together, see Prime Cost Explained: How Food and Labor Costs Work Together.
7. Why a Lower Food Cost Percentage Is Not Automatically Better
Operators sometimes chase a lower food-cost percentage while overlooking contribution dollars. A lower percentage could result from a higher price, lower cost, smaller portion, or different ingredients. The operating outcome also depends on guest demand, perceived value, contribution dollars, menu mix, labor, and the broader economics of the business.
What Is Food Cost Percentage? How to Calculate It and Use It explains why the percentage is a diagnostic tool rather than a universal verdict.
8. Contribution Margin and Menu Pricing
Current price
Price: $15.00
Direct cost: $5.19
Contribution: $9.81
Target-price scenario
Price: $17.30
Direct cost: $5.19
Contribution: $12.11
$17.30 − $5.19 = $12.11
The mathematical contribution increases, but that does not establish that $17.30 is a viable menu price. Guest value, positioning, and demand still determine whether the scenario makes sense. How to Price a Menu Item: Cost, Contribution, and Guest Value connects those considerations.
9. Contribution Margin and Break-Even
Fixed costs must be covered by what remains after variable costs, so contribution margin directly affects modeled break-even sales.
40% contribution margin
$30,000 fixed costs ÷ 0.40
Break-even sales: $75,000
35% contribution margin
$30,000 fixed costs ÷ 0.35
Break-even sales: approximately $85,714
When less contribution is generated per sales dollar, more sales are required to cover the same modeled fixed costs. Break-Even Point Explained: How Much Does Your Restaurant Need to Sell? develops this relationship in greater detail.
10. Contribution Margin and Sales Mix
A restaurant rarely sells only one item. Beverages, entrées, sides, appetizers, desserts, promotions, and delivery items can each produce different revenue, percentages, and contribution dollars. Changes in the mix of what guests buy can therefore change the restaurant’s blended contribution margin even when individual recipes and prices stay the same.
This is why an item-level result should be interpreted alongside actual sales mix rather than treated as the economics of the entire restaurant.
11. What Can Reduce Contribution Margin?
Direct or variable-cost drivers
Vendor-price increases, waste, yield or portion changes, packaging, transaction fees when included, promotions, discounts, and recipe changes.
Price or sales drivers
Price reductions, discounting, unfavorable mix, and insufficient price adjustment.
Model or data issues
Missing direct costs, inconsistent definitions, outdated recipe costs, and an incorrect sales basis.
Determining what changed is more useful than reacting to the percentage itself. The response to a vendor increase may differ from the response to discounting, poor yield, or incomplete data.
12. How to Evaluate Contribution More Usefully
- Define which costs are included.
- Verify the selling price.
- Verify current direct or variable costs.
- Calculate contribution dollars.
- Calculate contribution margin percentage.
- Compare against the intended operating model.
- Review guest value and demand.
- Consider menu mix.
- Connect the result to fixed-cost requirements.
- Test realistic alternatives.
- Monitor what actually happens.
There is no universal contribution-margin target that works for every restaurant or item. A useful benchmark must match the costs included, the restaurant’s concept, and the decision being made.
13. The Better Question
Instead of asking only, “What is the margin on this item?” ask:
“How much does this sale contribute toward the rest of the operation, what is driving that contribution, and does the pricing and cost structure still make sense for the guest and the business?”
This moves the conversation beyond chasing a percentage. It connects the number to the guest, the menu, fixed-cost requirements, and the operating model the restaurant is trying to support.
FREE TOOL
See what each menu item is contributing.
Use the Food Cost Calculator to calculate direct recipe cost, Menu Price Less Direct Cost, Contribution Margin Before Labor & Overhead, and test how pricing, portions, and cost changes affect the economics of the item.